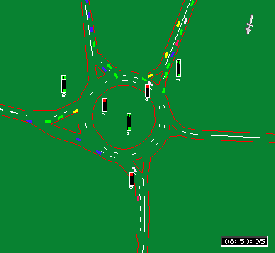
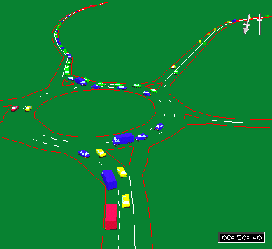
Traffic signal controlled junctions can make enormous differences to throughputs, but the conventional graphs and charts produced by traditional traffic modelling programs are difficult to understand for non-technical people, such as council members and clients. Paramics allows visual interpretation of the way in which various options will affect the traffic, enabling schemes to be more easily explained to non-experts. The diagrams below show a frame from typical runs. Double click the image to load a short clip which illustrates the type of visual output available, that can be used to show the effects of various options. This is especially useful when used real-time, when options presented by, for example, a local councillor, can be evaluated almost instantaneously. Note: These clips needs QuickTime to run, available as a free download from http://www.apple.com/quicktime/download/ Hit ‘Back’ to return after video has run.